
 Try Wonders for free
FRONTIER SCIENCE · CLIMATE · SEPTEMBER 24, 2026
In 1997–98, El Niño floods and droughts were linked to an estimated more than 22,000 deaths.
A stronger one may be forming; what it brings will differ from place to place.
The estimate covers flooding and drought across Africa, the Americas and Southeast Asia (Buizer et al., 2000). Here is what the next one could do where you live, and what to do this week.
NOAA puts it at three chances in four (75%) that by October–December this is the strongest El Niño in its index record, which goes back to 1950 (Climate Prediction Center, 2026d).
2 · WHERE YOU LIVE
What it could do where you live, and the one thing to do about it.
California
In 1997–98 the state reported 17 storm deaths. Strong El Niño winters often bring heavy rainstorms and mudslides, though not always, and climate scientist Marshall Shepherd says the rain grows extra vegetation that later dries into fuel for a worse fire season, a year or two on (National Climatic Data Center, 1998; Ward, 2026).
Do this: A new National Flood Insurance Program policy usually takes effect 30 days after you buy it, so buy it at least a month before the storms (FloodSmart, n.d.).
The South and Southeast
In February 1998, tornadoes in central Florida killed 42 people. Strong El Niño winters here tend to be wetter and cooler (National Climatic Data Center, 1998; Ward, 2026). In Florida, 44 of 67 counties were wetter than normal in six or seven of the seven strongest El Niño winters; in Georgia, 92 of 159 (Vose et al., 2014b).
Do this: Pick your tornado shelter now and practise getting there: a safe room or storm shelter, or else a small, interior, windowless room or basement on the lowest level of a sturdy building (Ready.gov, n.d.-b).
The northern states
In 1997–98 the northern half of the country had a much warmer winter than normal, with less rain and snow. One winter is not a pattern: plan for a normal winter’s storms (Changnon, 1999).
Do this: A milder winter is not a safe one. Gather supplies in case you need to stay home for several days without power, and test your smoke and carbon monoxide alarms (Ready.gov, n.d.-d).
The Pacific Northwest
In El Niño years, days of heavy winter rain, and later of high stream flow, tend to be less frequent than average (Cayan et al., 1999).
Do this: That is a tendency, not a promise: keep your flood plan. A new National Flood Insurance Program policy usually takes effect 30 days after you buy it, so buy it at least a month before the storms (FloodSmart, n.d.).
Hawaii
In the three strongest El Niño winters since 1991, all five of Hawaii’s counties were drier than normal in 1997–98 and 2015–16, and all but Kauai in 1991–92. (NOAA’s county-level dataset for Hawaii starts in 1991.) (Vose et al., 2014b)
Do this: Check your National Weather Service office’s seasonal outlook: this is a tendency, not a certainty, so plan for a normal winter’s storms anyway. Your ZIP code below finds the office.
3 · THE LAST TIME
It has happened before.
In central Florida in February 1998, tornadoes killed 42 people and destroyed more than 800 homes (National Climatic Data Center, 1998).
In 1997–98, El Niño flooding and drought across Africa, Latin America, North America and Southeast Asia were linked to an estimated more than 22,000 deaths and over $36 billion in damage (Buizer et al., 2000).
- In the United States, one study attributed 189 deaths that winter to El Niño-linked weather, many of them in tornadoes, and estimated that the lack of bad winter weather elsewhere avoided about 850 (Changnon, 1999).
- In the 1997–98 El Niño winter, California reported 17 storm deaths and more than $550 million in damage (National Climatic Data Center, 1998).
Wildlife
- 1998The first global coral bleaching event on record (NOAA Coral Reef Watch, n.d.).
- >90%In the 1998 bleaching, some reefs lost more than 90% of their coral, and pristine, remote reefs were hit as hard as reefs already under human stress (Wilkinson, 2000).
- 77%After the 1982–83 El Niño, the Galápagos penguin population fell by 77% (Valle & Coulter, 1987).
What you can do starts with your own county, just below.
4 · YOUR COUNTY
What the strongest El Niño winters brought to your county, and your plan.
Your plan follows the four things climate scientist Marshall Shepherd says to do: know what El Niño tends to do where you live, know your National Weather Service office, check the weather before bed, and know where your important papers are (Ward, 2026).
5 · NO GUARANTEE
A strong El Niño doesn’t tell you which winter you’ll get. Prepare for the wet one.
By NOAA’s relative index, 1997–98 and 2015–16 were almost equally strong El Niño winters. Los Angeles County got 223% of its normal winter rain in the first, and 55% in the second. A 2017 review describes 2015–16 as characteristically distinct from 1997–98, while still counting it as an extreme El Niño (Santoso et al., 2017).
(Climate Prediction Center, 2026a; Vose et al., 2014b)
Prepare for the wet one, and follow your National Weather Service office’s outlook for your area as the season goes on.
223%
1997–98
California counties, share of normal Dec–Feb rain
55%
2015–16
Same counties, a similar El Niño
6 · THE VICIOUS CYCLE
Rain, then floods, then fuel, then fire.
- 1
Heavier winter rain
In the seven strongest El Niño winters since 1950, ranked by NOAA’s relative index for December to February, Los Angeles County was wetter than normal in five (Vose et al., 2014b).
- 2
Floods and mudslides
In 1997–98, a federal disaster declaration for California’s severe winter storms and flooding covered 41 of its 58 counties (Federal Emergency Management Agency, 2026).
What to do: Six inches of fast-moving water can knock over an adult, and 12 inches can carry away most cars. More than half of flood drownings happen when a vehicle is driven into flood water (National Weather Service, n.d.-c). A new National Flood Insurance Program policy usually takes effect 30 days after you buy it, so buy it at least a month before the storms (FloodSmart, n.d.).
- 3
Then, more fuel
“You get a lot of vegetation growth” (Ward, 2026).
- 4
A worse fire season, a year or two later
“When things dry out, all of that vegetation dries out, and that exacerbates or amplifies the fire season” (Ward, 2026).
What to do: Before the fire season, clear leaves, debris and anything flammable for at least 30 feet around your home (Ready.gov, n.d.-c). After a wildfire, flood risk stays significantly higher for up to five years, until plants grow back (Federal Emergency Management Agency, n.d.).
And drought? In one set of model simulations under high emissions, both intense drought and excessive flooding in California rise by at least 50% toward the end of the century (Yoon et al., 2015). That is a projection, not a forecast for this winter.
7 · THE FRONTIER
Who is working out what comes next.
Michelle L. L’Heureux and colleagues
NOAA Climate Prediction Center · Journal of Climate, 2024
One study found that in each of three ocean-temperature records, measuring El Niño against the whole tropics classified past El Niños and La Niñas more consistently than the old index, with less dependence on which baseline period is used (L’Heureux et al., 2024).
Xingying Huang and Samantha Stevenson
National Center for Atmospheric Research · Geophysical Research Letters, 2023
In one study’s climate models, the gap between El Niño and La Niña years in projected changes to California’s most extreme rain was larger than the overall climate-change signal, so how models simulate El Niño adds uncertainty (Huang & Stevenson, 2023).
J. Vialard and colleagues
LOCEAN-IPSL, Paris · Reviews of Geophysics, 2025
A simple model of how heat stored in the equatorial Pacific builds an El Niño, and how random bursts of westerly wind add to it (Vialard et al., 2025).
Tao Geng and colleagues
Laoshan Laboratory · Nature Communications, 2024
In one modelling study under high emissions, El Niño’s swings grow until 2100, then shrink far below their 20th-century size as the eastern Pacific settles into a persistent El Niño-like warm pattern (Geng et al., 2024).
8 · DO THIS WEEK
Seven things to do before the storms.
- 1Buy or check your flood insuranceA new National Flood Insurance Program policy usually takes effect 30 days after you buy it, so buy it at least a month before the storms (FloodSmart, n.d.).
- 2Make sure your phone gets emergency alertsPhones that can receive Wireless Emergency Alerts get them automatically in an emergency, with no sign-up and no charge (National Weather Service, n.d.-d).
- 3Know your National Weather Service officeYour ZIP code above names the office that issues the warnings for your address, with its phone number.
- 4Pick your tornado shelterPick your tornado shelter now and practise getting there: a safe room or storm shelter, or else a small, interior, windowless room or basement on the lowest level of a sturdy building (Ready.gov, n.d.-b).
- 5Put your important papers in one placeReady.gov says to keep important documents in a safe deposit box, on an external drive or in the cloud (Ready.gov, n.d.-a).
- 6If wildfires burn where you live, clear 30 feetBefore the fire season, clear leaves, debris and anything flammable for at least 30 feet around your home (Ready.gov, n.d.-c).
- 7Every night this winter, check the forecast before bed“have a night plan for weather. What I mean by that is the same way that we brush our teeth or wash our faces at night, have some sense … of what the weather is going to be like before you go to bed, in case you have to spring into action” (Ward, 2026).
El Niño does tend to calm the Atlantic: every hurricane season during a strong El Niño since 1950 has been below normal, and NOAA gives 2026 three chances in four (75%) of a below-normal season. It also warns that it only takes one hurricane or tropical storm to cause a disaster (Climate Prediction Center, 2026c). If you live on the coast, keep your hurricane plan as it is.
Go deeper
Every county, in the seven strongest winters
Each county is coloured by how many of the seven strongest El Niño winters since 1950 brought more December–February rain than its 1991–2020 normal (Climate Prediction Center, 2026a; Vose et al., 2014b).
- 0–1 of 7 lighter winter rain in most363 counties
- 2 of 7 lighter more often365 counties
- 3–4 of 7 no clear pattern1,271 counties
- 5 of 7 heavier winter rain more often687 counties
- 6–7 of 7 heavier winter rain in most449 counties
449 counties were wetter than normal in six or seven of the seven winters; the largest shares are in Florida (44 of 67 counties), Georgia (92 of 159 counties) and Alabama (30 of 67 counties). 363 were wetter in one or none, most of all in Ohio (77 of 88 counties), Montana (34 of 56 counties) and Indiana (53 of 92 counties). Hawaii’s counties are hatched: NOAA’s county-level dataset there starts in 1991, so it covers three of the seven winters.
Your state: Alabama · Alaska · Arizona · Arkansas · California · Colorado · Connecticut · Delaware · Florida · Georgia · Hawaii · Idaho · Illinois · Indiana · Iowa · Kansas · Kentucky · Louisiana · Maine · Maryland · Massachusetts · Michigan · Minnesota · Mississippi · Missouri · Montana · Nebraska · Nevada · New Hampshire · New Jersey · New Mexico · New York · North Carolina · North Dakota · Ohio · Oklahoma · Oregon · Pennsylvania · Rhode Island · South Carolina · South Dakota · Tennessee · Texas · Utah · Vermont · Virginia · Washington · Washington, DC · West Virginia · Wisconsin · Wyoming
Every El Niño and La Niña since 1950
How much warmer or cooler the central Pacific is than the rest of the tropical oceans, over three months at a time (Climate Prediction Center, 2026a, 2026b). The seven labelled winters crossed 1.5 °C. As of NOAA’s September 10 update, El Niño was still strengthening, with a greater than 90% chance of a very strong event through the Northern Hemisphere fall and winter (Climate Prediction Center, 2026d).
What the research says
A 1986 study of weather-station records mapped El Niño’s typical rain and temperature patterns across North America (Ropelewski & Halpert, 1986). In El Niño years, days of heavy winter rain, and later days of high stream flow, are more frequent than average in the US Southwest and less frequent in the Northwest (Cayan et al., 1999).
In observations from 1901 to 2010, El Niño’s pull on California rain grows from early to late winter and is stronger in the south than the north; eight of ten moderate-to-strong events put southern California’s late winter in its wettest third (Jong et al., 2016). In one study’s climate-model simulations of November–April rain, weak and moderate El Niños barely changed the odds of a wet or dry season in northern and central California, while strong ones raised the odds of a wet one across the whole state (Hoell et al., 2016).
The 2015–16 event is counted with 1982–83 and 1997–98 as an extreme El Niño, but it behaved differently from both, and its strength is attributed in part to unusually warm conditions in 2014 and to long-term background warming (Santoso et al., 2017). In Los Angeles County, 2015–16 brought 55% of the normal December–February rain (Vose et al., 2014b).
In one study using large ensembles of climate models, projected increases in California’s extreme precipitation were much larger in El Niño years than in La Niña years, mainly because extreme events became more frequent in El Niño years than in La Niña years. For the most extreme events, the difference between El Niño and La Niña was larger than the overall climate-change signal, which the authors say makes how models handle El Niño a source of uncertainty (Huang & Stevenson, 2023). In one modelling study under a high-emission scenario, El Niño’s swings grow until 2100 and then shrink far below their 20th-century size, as the eastern Pacific keeps warming in a persistent El Niño-like pattern (Geng et al., 2024).
The recharge oscillator, two equations linking equatorial Pacific surface temperature to the heat stored in the ocean below, reproduces El Niño’s amplitude, timescale and seasonality; extended versions add random bursts of westerly wind, and a 29-author review sets out how it is being taken to open questions (Vialard et al., 2025).
How far to trust seven winters
Seven is a small sample, and this winter is forecast to be stronger than any of them (Climate Prediction Center, 2026d). Your county’s bars show what happened, not a forecast; for the season ahead, your forecast office is the source to follow.
Global warming makes El Niño events look bigger than they are in the older index; the relative index subtracts the warming of all tropical oceans (van Oldenborgh et al., 2021). In February 2026, NOAA’s Climate Prediction Center announced it was moving to the relative index, which compares the El Niño region with the global tropics (Climate Prediction Center, 2026b). A winter counts here when its December–February value was 1.5 °C or more. By the older index, 2023–24 would also qualify and 1965–66 would not.
How this post was made
County rain is NOAA’s monthly county series (file climdiv-pcpncy-v1.0.0-20260904), built from station data interpolated to a 5 km grid and averaged over each county (Vose et al., 2014a, 2014b). A winter is the sum of December, January and February; the normal is the mean of the 1991–2020 winters. Comparing 1950s winters with a recent normal folds any long-term change into the older bars, so temperature is left out. Winter strength is the December–February RONI (Climate Prediction Center, 2026a).
Disasters are FEMA’s county designations for floods, storms, landslides, tornadoes, snow and ice, and coastal and tropical storms beginning November to April, counted from 1965–66, when FEMA’s records start carrying counties (Federal Emergency Management Agency, 2026). County names are the Census Bureau’s (U.S. Census Bureau, 2020); ZIP codes are placed at the Census internal point (U.S. Census Bureau, 2024); office, forecast and alerts come from the National Weather Service API, called from your browser (National Weather Service, n.d.-a). Nothing you type is stored.
Every paper was checked for retractions and corrections and judged for its design, standing and limits; every sentence about a source was checked word for word against it, then read against it by a separate model review for overstatement and missing context. The funders on record are public research agencies and one philanthropic fund. For 9 of the 15 papers, funding is not in the public metadata and the acknowledgements could not be read; no commercial funder appears for any of them. Data retrieved September 24, 2026.
References
- Buizer, J. L., Foster, J., & Lund, D. (2000). Global Impacts and Regional Actions: Preparing for the 1997–98 El Niño. Bulletin of the American Meteorological Society, 81(9), 2121–2139. https://doi.org/10.1175/1520-0477(2000)081<2121:giarap>2.3.co;2
- Cayan, D. R., Redmond, K. T., & Riddle, L. G. (1999). ENSO and Hydrologic Extremes in the Western United States. Journal of Climate, 12(9), 2881–2893. https://doi.org/10.1175/1520-0442(1999)012<2881:eaheit>2.0.co;2
- Changnon, S. A. (1999). Impacts of 1997—98 El Niño Generated Weather in the United States. Bulletin of the American Meteorological Society, 80(9), 1819–1827. https://doi.org/10.1175/1520-0477(1999)080<1819:ioenog>2.0.co;2
- Climate Prediction Center. (2026a). Relative Oceanic Niño Index (RONI) [Dataset]. National Oceanic and Atmospheric Administration. https://www.cpc.ncep.noaa.gov/data/indices/RONI.ascii.txt
- Climate Prediction Center. (2026b, February). CPC adopts Relative Oceanic Niño Index (RONI) for reliable, responsive monitoring and tracking of ENSO. National Oceanic and Atmospheric Administration. https://www.cpc.ncep.noaa.gov/products/analysis_monitoring/enso/roni/announcement.php
- Climate Prediction Center. (2026c, August 6). NOAA 2026 Atlantic hurricane season outlook update. National Oceanic and Atmospheric Administration. https://tgftp.nws.noaa.gov/data/raw/fx/fxnt20.kwnc.pmd.ahu.txt
- Climate Prediction Center. (2026d, September 10). El Niño/Southern Oscillation (ENSO) diagnostic discussion. National Oceanic and Atmospheric Administration. https://www.cpc.ncep.noaa.gov/products/analysis_monitoring/enso_advisory/ensodisc.shtml
- Federal Emergency Management Agency. (n.d.). Flood after fire: The increased risk. Ready.gov. Retrieved https://www.ready.gov/sites/default/files/Flood_After_Fire_Fact_Sheet.pdf
- Federal Emergency Management Agency. (2026). OpenFEMA dataset: Disaster Declarations Summaries - v2 [Dataset]. https://www.fema.gov/openfema-data-page/disaster-declarations-summaries-v2
- FloodSmart. (n.d.). Buy a policy. Federal Emergency Management Agency. Retrieved September 24, 2026, from https://www.floodsmart.gov/get-insured/buy-a-policy
- Geng, T., Cai, W., Jia, F., & Wu, L. (2024). Decreased ENSO post-2100 in response to formation of a permanent El Niño-like state under greenhouse warming. Nature Communications, 15(1), 5810. https://doi.org/10.1038/s41467-024-50156-9
- Hoell, A., Hoerling, M., Eischeid, J., Wolter, K., Dole, R., Perlwitz, J., Xu, T., & Cheng, L. (2016). Does El Niño intensity matter for California precipitation? Geophysical Research Letters, 43(2), 819–825. https://doi.org/10.1002/2015gl067102
- Huang, X., & Stevenson, S. (2023). Contributions of Climate Change and ENSO Variability to Future Precipitation Extremes Over California. Geophysical Research Letters, 50(12), e2023GL103322. https://doi.org/10.1029/2023gl103322
- Jong, B.-T., Ting, M., & Seager, R. (2016). El Niño’s impact on California precipitation: seasonality, regionality, and El Niño intensity. Environmental Research Letters, 11(5), 054021. https://doi.org/10.1088/1748-9326/11/5/054021
- L’Heureux, M. L., Tippett, M. K., Wheeler, M. C., Nguyen, H., Narsey, S., Johnson, N., Hu, Z.-Z., Watkins, A. B., Lucas, C., Ganter, C., Becker, E., Wang, W., & Di Liberto, T. (2024). A Relative Sea Surface Temperature Index for Classifying ENSO Events in a Changing Climate. Journal of Climate, 37(4), 1197–1211. https://doi.org/10.1175/jcli-d-23-0406.1
- National Climatic Data Center. (1998). Service Assessment and Report: The winter of 1997–1998 severe storms (Technical Report 98-02). NOAA National Climatic Data Center. https://www.ncei.noaa.gov/monitoring-content/billions/reports/19971201-19980228-severe-storm/tr9802.pdf
- National Weather Service. (n.d.-a). API web service. National Oceanic and Atmospheric Administration. Retrieved September 24, 2026, from https://www.weather.gov/documentation/services-web-api
- National Weather Service. (n.d.-b). NOAA Weather Radio. National Oceanic and Atmospheric Administration. Retrieved September 24, 2026, from https://www.weather.gov/nwr/
- National Weather Service. (n.d.-c). Turn Around Don’t Drown. National Oceanic and Atmospheric Administration. Retrieved September 24, 2026, from https://www.weather.gov/safety/flood-turn-around-dont-drown
- National Weather Service. (n.d.-d). Wireless Emergency Alerts. National Oceanic and Atmospheric Administration. Retrieved September 24, 2026, from https://www.weather.gov/wrn/wea
- NOAA Coral Reef Watch. (n.d.). Coral bleaching events. National Oceanic and Atmospheric Administration. Retrieved September 24, 2026, from https://coralreefwatch.noaa.gov/satellite/research/coral_bleaching_report.php
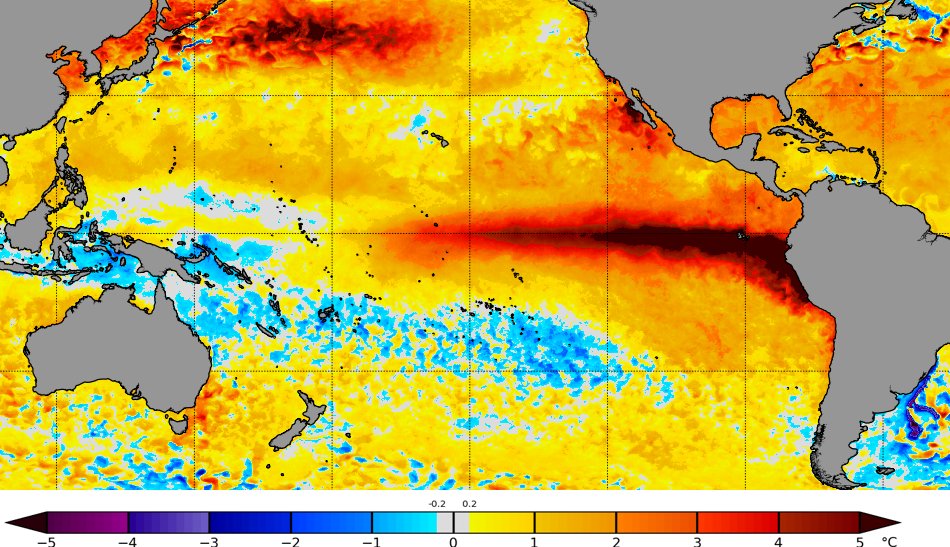
- NOAA Coral Reef Watch. (2026). Daily 5km sea surface temperature anomalies (v3.1), 23 September 2026 [Graphic]. https://coralreefwatch.noaa.gov/product/5km/index_5km_ssta.php
- Ready.gov. (n.d.-a). Financial preparedness. U.S. Department of Homeland Security. Retrieved September 24, 2026, from https://www.ready.gov/financial-preparedness
- Ready.gov. (n.d.-b). Tornadoes. U.S. Department of Homeland Security. Retrieved September 24, 2026, from https://www.ready.gov/tornadoes
- Ready.gov. (n.d.-c). Wildfires. U.S. Department of Homeland Security. Retrieved September 24, 2026, from https://www.ready.gov/wildfires
- Ready.gov. (n.d.-d). Winter weather. U.S. Department of Homeland Security. Retrieved September 24, 2026, from https://www.ready.gov/winter-weather
- Ropelewski, C. F., & Halpert, M. S. (1986). North American Precipitation and Temperature Patterns Associated with the El Niño/Southern Oscillation (ENSO). Monthly Weather Review, 114(12), 2352–2362. https://doi.org/10.1175/1520-0493(1986)114<2352:napatp>2.0.co;2
- Santoso, A., McPhaden, M. J., & Cai, W. (2017). The Defining Characteristics of ENSO Extremes and the Strong 2015/2016 El Niño. Reviews of Geophysics, 55(4), 1079–1129. https://doi.org/10.1002/2017rg000560
- U.S. Census Bureau. (2020). 2020 FIPS codes for counties and county equivalent entities [Dataset]. https://www2.census.gov/geo/docs/reference/codes2020/national_county2020.txt
- U.S. Census Bureau. (2024). 2024 Gazetteer files: ZIP Code Tabulation Areas [Dataset]. https://www.census.gov/geographies/reference-files/time-series/geo/gazetteer-files.html
- Valle, C. A., & Coulter, M. C. (1987). Present Status of the Flightless Cormorant, Galapagos Penguin and Greater Flamingo Populations in the Galapagos Islands, Ecuador, after the 1982-83 El Nino. The Condor, 89(2), 276. https://doi.org/10.2307/1368480
- van Oldenborgh, G. J., Hendon, H., Stockdale, T., L’Heureux, M., Coughlan de Perez, E., Singh, R., & van Aalst, M. (2021). Defining El Niño indices in a warming climate. Environmental Research Letters, 16(4), 044003. https://doi.org/10.1088/1748-9326/abe9ed
- Vialard, J., Jin, F. ‐F., McPhaden, M. J., Fedorov, A., Cai, W., An, S. ‐I., Dommenget, D., Fang, X., Stuecker, M. F., Wang, C., Wittenberg, A., Zhao, S., Liu, F., Kim, S. ‐K., Planton, Y., Geng, T., Lengaigne, M., Capotondi, A., Chen, N., … Thual, S. (2025). The El Niño Southern Oscillation (ENSO) Recharge Oscillator Conceptual Model: Achievements and Future Prospects. Reviews of Geophysics, 63(1), e2024RG000843. https://doi.org/10.1029/2024rg000843
- Vose, R. S., Applequist, S., Squires, M., Durre, I., Menne, M. J., Williams, C. N., Fenimore, C., Gleason, K., & Arndt, D. (2014a). Improved Historical Temperature and Precipitation Time Series for U.S. Climate Divisions. Journal of Applied Meteorology and Climatology, 53(5), 1232–1251. https://doi.org/10.1175/jamc-d-13-0248.1
- Vose, R. S., Applequist, S., Squires, M., Durre, I., Menne, M. J., Williams, C. N., Fenimore, C., Gleason, K., & Arndt, D. (2014b). NOAA Monthly U.S. Climate Divisional Database (NClimDiv) [Dataset]. NOAA National Centers for Environmental Information. https://doi.org/10.7289/V5M32STR
- Ward, A. (2026, September 16). Extreme meteorology (El Niño) with Dr. Marshall Shepherd [Audio podcast episode]. In Ologies with Alie Ward. https://www.alieward.com/ologies/extrememeteorology
- Wilkinson, C. (Ed.). (2000). Status of coral reefs of the world: 2000. Australian Institute of Marine Science. https://www.icriforum.org/wp-content/uploads/2019/12/gcrmn2000.pdf
- Yoon, J.-H., Wang, S.-Y. S., Gillies, R. R., Kravitz, B., Hipps, L., & Rasch, P. J. (2015). Increasing water cycle extremes in California and in relation to ENSO cycle under global warming. Nature Communications, 6(1), 8657. https://doi.org/10.1038/ncomms9657